SETUP ADVANCED
Asia AMD
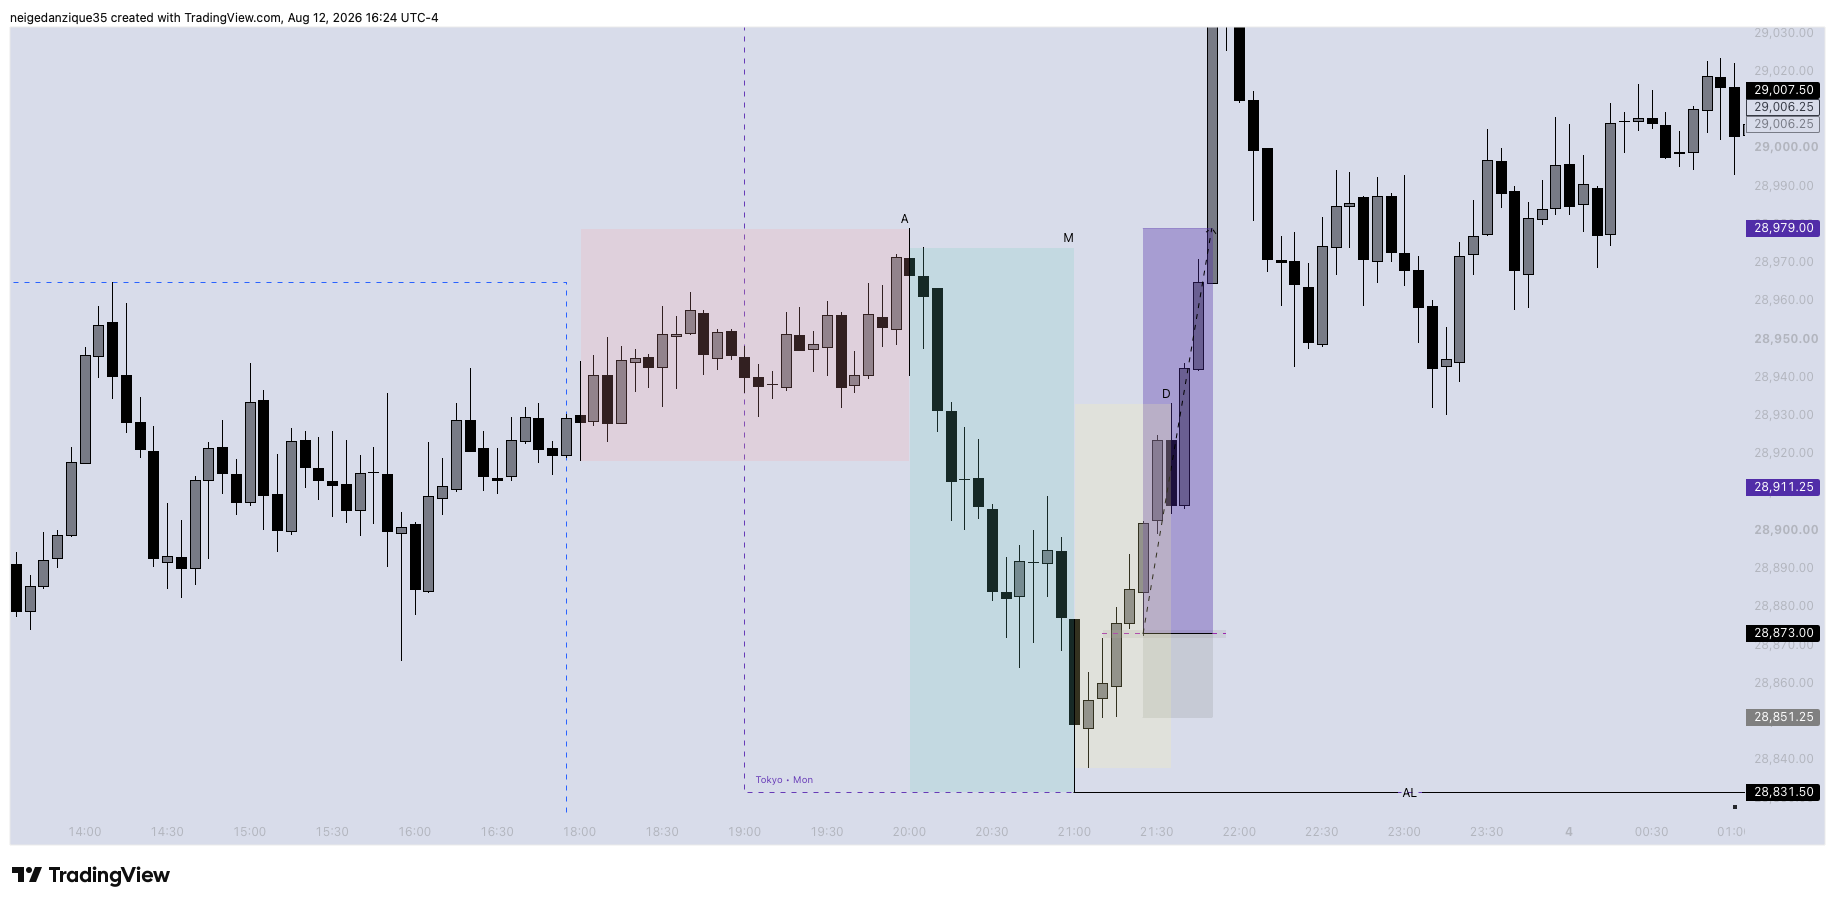
This lesson introduces the Asia AMD setup and the sequence I use to identify it. You will learn how to recognize Accumulation, wait for Manipulation, confirm that Distribution has begun, identify the first 5-minute Fair Value Gap created during Distribution, and use the 50% midpoint of that FVG as the entry level.
By the end of this lesson, you should understand the basic structure of my Asia AMD setup and be able to identify each phase in the correct order.
You should be able to answer:
- Where is Accumulation?
- Where did Manipulation occur?
- Has Distribution actually begun?
- What is the first 5-minute FVG created during Distribution?
- Where is the midpoint of that FVG?
- Did price retrace to the midpoint?
- Was there a valid entry or no trade?
The basic model is:
Accumulation → Manipulation → Distribution → First 5-Minute FVG → 50% Midpoint Entry
The most important thing to understand is that the FVG is not the strategy by itself.
The AMD sequence is what gives that FVG meaning.
1. What Is AMD?
AMD stands for:
A — Accumulation
M — Manipulation
D — Distribution
AMD is a way of reading a sequence in price.
Instead of looking at every candle as a separate event, we are looking for a story.
First, price establishes a range.
Then, one side of that range is attacked.
After that, price begins moving with more directional purpose.
That is the basic AMD sequence.
For this setup, I use AMD during the Asia session.
2. The Full Setup in Simple Terms
The setup can be simplified into five stages.
Stage 1 — Accumulation
Price creates a recognizable range.
Stage 2 — Manipulation
Price moves through one side of that range and accesses liquidity.
Stage 3 — Distribution
Price begins delivering in the opposite direction with clear expansion.
Stage 4 — First 5-Minute FVG
I identify the first Fair Value Gap created on the 5-minute chart during Distribution.
Stage 5 — Entry
I calculate the 50% midpoint of that FVG and use that midpoint as my entry level.
That is the complete beginner framework.
3. Accumulation
Accumulation is the first part of the setup.
During Accumulation, price is generally moving inside a recognizable range.
The market may be:
- Moving sideways
- Creating overlapping candles
- Trading repeatedly between a high and low
- Showing less directional commitment
- Building visible boundaries
The most important thing is that you can identify:
Accumulation High
and
Accumulation Low
Those boundaries matter because liquidity can build around them.
4. Why the Accumulation Range Matters
Imagine Asia spends time trading between:
20,200
and
20,300
For a period of time, price repeatedly moves inside that range.
The high becomes visible.
The low becomes visible.
Traders may begin viewing:
20,300 as resistance.
20,200 as support.
Breakout traders may place orders above the high.
Breakdown traders may place orders below the low.
Stop losses may also collect around those boundaries.
This creates two obvious areas of liquidity.
Above the range:
Buy-side liquidity
Below the range:
Sell-side liquidity
That is what makes Manipulation possible.
5. Accumulation Should Be Recognizable
Do not call every small pause in price Accumulation.
You should be able to look at the chart and reasonably identify a range.
A clean accumulation may show:
- Several candles trading inside the same area
- A recognizable high
- A recognizable low
- Repeated interaction with both sides
- Limited directional expansion
If you need to force the range after seeing the final move, the setup may not be clean enough.
6. Manipulation
Manipulation is the second phase.
This occurs when price moves beyond one side of the Accumulation range.
For a bullish AMD setup, Manipulation commonly occurs below the Accumulation low.
For a bearish AMD setup, Manipulation commonly occurs above the Accumulation high.
The Manipulation is the liquidity event.
But this is extremely important:
Manipulation is not my entry.
I do not enter simply because a high or low was swept.
I wait for Distribution.
7. Bullish Manipulation
Suppose the Accumulation range is:
High:
20,300
Low:
20,200
Price suddenly moves below:
20,200
and reaches:
20,165
Sell-side liquidity below the range has now been accessed.
A beginner may immediately think:
“Price swept the low. Buy.”
That is too early.
Price could continue lower.
The sweep only tells me that one side of the range has been taken.
Now I need to see what price does next.
8. Bearish Manipulation
Now suppose the Accumulation range is:
High:
20,500
Low:
20,400
Price pushes above:
20,500
and reaches:
20,540
Buy-side liquidity above the range has been accessed.
Again:
I am not automatically shorting.
Price may continue higher.
I wait to see whether sellers actually begin Distribution.
9. Manipulation Does Not Guarantee Reversal
This is one of the biggest mistakes newer traders make with AMD.
They see:
Sweep below the low.
Then assume:
Bullish.
Or they see:
Sweep above the high.
Then assume:
Bearish.
But a sweep does not guarantee reversal.
Price can sweep a low and keep falling.
Price can sweep a high and keep rising.
That is why the next phase matters so much.
I want the market to actually show Distribution.
10. Distribution
Distribution is the directional part of the AMD sequence.
This is where price begins moving away from the Manipulation with more purpose.
Bullish Distribution may include:
- Strong bullish candles
- Bullish displacement
- Reduced candle overlap
- Strong closes
- Price moving away from the Manipulation low
- Short-term structure beginning to turn bullish
Bearish Distribution may include:
- Strong bearish candles
- Bearish displacement
- Reduced overlap
- Strong closes lower
- Price moving away from the Manipulation high
- Short-term structure beginning to turn bearish
Distribution is what tells me:
Now I can start looking for my entry framework.
11. Bullish Distribution
Suppose:
Accumulation Low:
20,200
Manipulation Low:
20,165
Price then begins moving:
20,190
20,215
20,245
20,280
20,320
Price is no longer simply reacting.
It is delivering higher.
That is what I want to see.
Once bullish Distribution begins, I move to the next step:
Find the first bullish 5-minute FVG created during that Distribution.
12. Bearish Distribution
Suppose:
Accumulation High:
20,500
Manipulation High:
20,540
Price begins moving:
20,515
20,480
20,445
20,410
20,370
The market is now delivering lower.
That is bearish Distribution.
Now I begin looking for:
The first bearish 5-minute FVG created during Distribution.
13. Why I Wait for Distribution Before Looking for the FVG
There may be several FVGs on the chart before Distribution.
There may be an FVG inside Accumulation.
There may be an FVG during Manipulation.
Those are not automatically the ones I am looking for.
For this setup, I specifically want:
The first 5-minute FVG created during Distribution.
The order matters.
I do not begin with:
“Where is an FVG?”
I begin with:
“Where is A?”
“Where is M?”
“Has D started?”
Then:
“Where is the first 5-minute FVG?”
14. What Is a Fair Value Gap?
A Fair Value Gap, or FVG, is an area created when price moves aggressively enough that three consecutive candles show limited overlap.
It is a visual representation of imbalance.
The market moved through that area quickly rather than spending a lot of time trading back and forth.
For a beginner, think of it as:
A gap in efficient price delivery created during strong movement.
The FVG gives me a specific area where I can watch for price to retrace.
15. Bullish Fair Value Gap
A basic bullish FVG is formed using three candles.
You look at:
Candle 1 High
and
Candle 3 Low
If Candle 3's low remains above Candle 1's high, there is a gap between them.
Example:
Candle 1 High:
20,240
Candle 3 Low:
20,260
Bullish FVG:
20,240 to 20,260
That 20-point area becomes the FVG.
16. Bearish Fair Value Gap
A bearish FVG is the opposite.
You look at:
Candle 1 Low
and
Candle 3 High
If Candle 3's high remains below Candle 1's low, there is a bearish FVG.
Example:
Candle 1 Low:
20,460
Candle 3 High:
20,440
Bearish FVG:
20,440 to 20,460
17. I Want the First 5-Minute FVG
This is a key rule of the setup.
Distribution may eventually create:
- One FVG
- Two FVGs
- Three FVGs
- Several more
For the beginner version of my AMD model, I focus on:
The first 5-minute FVG created during Distribution.
I am not choosing whichever FVG looks best after the move is complete.
I identify the first one in sequence.
That gives the setup an objective framework.
18. Why the First FVG Matters
The first FVG is created during the initial directional move away from Manipulation.
Instead of chasing Distribution after price has already expanded, I now have a specific retracement area.
The sequence becomes:
Distribution begins.
First 5-minute FVG forms.
Price retraces.
I look for the midpoint.
That gives me my entry level.
19. Finding the Midpoint
The midpoint is simply 50% of the Fair Value Gap.
You can calculate it using:
FVG High + FVG Low
Then divide by:
2
Example:
FVG Low:
20,240
FVG High:
20,260
Calculation:
20,240 + 20,260 = 40,500
40,500 ÷ 2 = 20,250
Midpoint:
20,250
That 20,250 level becomes my entry price for this simplified setup.
20. The 50% Level
The midpoint of the FVG is also called the:
50% level
or sometimes:
Consequent Encroachment
For Tick Lab, the important thing is simply:
You have a Fair Value Gap.
Measure the full gap.
Find the halfway price.
That is the level I use for my entry.
21. Bullish Asia AMD Entry
Now we put the bullish setup together.
Step 1
Asia creates Accumulation.
Example:
High:
20,300
Low:
20,200
Step 2
Price manipulates below the range.
Manipulation Low:
20,160
Step 3
Bullish Distribution begins.
Price expands:
20,190
20,230
20,270
20,310
Step 4
The first bullish 5-minute FVG forms.
FVG:
20,220 to 20,250
Step 5
Calculate the midpoint.
20,220 + 20,250 = 40,470
40,470 ÷ 2 = 20,235
Entry:
20,235
Now I wait for price to retrace to:
20,235
That is the basic bullish AMD entry framework.
22. Bullish Sequence
The entire bullish setup is:
Accumulation
↓
Manipulation Below the Range
↓
Bullish Distribution
↓
First Bullish 5-Minute FVG
↓
Calculate 50%
↓
Buy at the FVG Midpoint
That is the sequence students should memorize.
23. Bearish Asia AMD Entry
Now reverse the setup.
Step 1
Asia accumulates between:
20,400
and
20,500
Step 2
Price manipulates above the range.
Manipulation High:
20,540
Step 3
Bearish Distribution begins.
Price moves:
20,510
20,470
20,430
20,390
Step 4
The first bearish 5-minute FVG forms.
FVG:
20,440 to 20,470
Step 5
Calculate the midpoint.
20,440 + 20,470 = 40,910
40,910 ÷ 2 = 20,455
Entry:
20,455
Now I wait for price to retrace to:
20,455
That becomes the bearish entry level.
24. Bearish Sequence
The full bearish setup is:
Accumulation
↓
Manipulation Above the Range
↓
Bearish Distribution
↓
First Bearish 5-Minute FVG
↓
Calculate 50%
↓
Sell at the FVG Midpoint
25. The FVG Is Not the Setup
This is one of the most important lessons.
A beginner may learn FVGs and start seeing them everywhere.
Then every FVG becomes a reason to trade.
That is not what I am teaching.
For this setup:
The FVG comes last.
The market first has to give:
A
then
M
then
D
Only after that do I care about the first 5-minute FVG.
The complete model is:
AMD creates the setup.
The FVG creates the entry location.
26. Do Not Use an FVG From Accumulation
Suppose price is still inside the Asia range.
A bullish FVG forms.
That does not automatically become the AMD entry.
Why?
Because Manipulation has not happened yet.
Distribution has not happened yet.
The sequence is incomplete.
The FVG may be technically valid as an imbalance.
It is not the FVG required for this strategy.
27. Do Not Use the Manipulation FVG
Sometimes Manipulation itself may create an FVG.
Example:
Price aggressively breaks below the Accumulation low.
A bearish FVG forms during that move.
Then price reverses bullish.
For the bullish AMD strategy, I am not using that bearish FVG from Manipulation.
I am waiting for bullish Distribution.
Then I want the first bullish 5-minute FVG from that Distribution.
Again:
Sequence matters.
28. What If There Are Multiple FVGs?
Suppose bullish Distribution creates:
FVG 1
then
FVG 2
then
FVG 3
For this beginner setup, I am interested in:
FVG 1
The first 5-minute FVG created during Distribution.
Do not skip the first one because:
- It did not fill perfectly
- The second one looks cleaner
- The third one produced a larger winner
- You already know the final chart outcome
That would introduce hindsight.
29. What If Price Never Returns to the Midpoint?
This happens.
Suppose:
First bullish 5-minute FVG:
20,240 to 20,260
Midpoint:
20,250
Price only retraces to:
20,255
Then expands strongly higher.
Your entry was:
20,250
The midpoint was not reached.
That means:
No fill.
Do not chase.
Do not change the midpoint after the move.
Do not record the setup as a winning trade.
It was a valid setup with a missed entry.
30. Exact Midpoint Versus “Close Enough”
For the simplified Tick Lab model, keep the rule objective.
If the midpoint is:
20,250
then:
20,250 is the entry.
If price reaches:
20,251
and leaves, the midpoint was not reached.
This makes the strategy much easier to backtest.
Later, if your personal model has a defined tolerance, that can be tested separately.
Do not create tolerance after seeing the outcome.
31. No Distribution = No Entry
Suppose:
Accumulation forms.
The low is swept.
Price returns slightly into the range.
But price never produces meaningful bullish expansion.
Instead, price continues chopping.
You have:
A.
You have:
M.
But you do not have a clean:
D.
Therefore, you should not be searching for your Distribution FVG.
The sequence is incomplete.
32. No Clear Accumulation = No AMD
Suppose the market has been trending in one direction all Asia.
There is no recognizable range.
There is no clear high and low that created the Accumulation structure.
Then trying to force:
A
M
D
onto the chart may not make sense.
Not every session produces AMD.
The absence of the setup is information.
33. Manipulation Can Fail
Suppose price sweeps above the Accumulation high.
You expect possible bearish Distribution.
Instead, price continues:
Higher.
Higher.
Higher.
The market is accepting above the range.
The sweep did not produce the bearish AMD sequence.
That is not something you need to fight.
There is simply no bearish AMD entry under this framework.
34. Distribution Should Move Away
Distribution should actually create separation from the Manipulation area.
If price:
Sweeps.
Returns.
Sweeps again.
Returns again.
Crosses both sides repeatedly.
Then the directional story is weak.
Clean Distribution should be easier to recognize.
You should not have to convince yourself that the market is distributing.
35. Risk Still Matters
A valid AMD entry does not remove risk.
Before placing any order, the trader still needs to know:
- Where the trade becomes invalid
- Stop distance
- Position size
- Maximum financial risk
- Available account room
- A realistic target
The purpose of this lesson is to teach the entry framework.
It is not permission to ignore the risk-management lessons you already completed in Tick Lab.
36. The Five Questions
When studying Asia AMD, ask:
Question 1
Where is Accumulation?
Question 2
Which side was Manipulated?
Question 3
Has Distribution actually begun?
Question 4
Where is the first 5-minute FVG created during Distribution?
Question 5
Where is the 50% midpoint?
If you cannot answer the first four questions clearly, you should not be worried about Question 5 yet.
Common Beginner Mistake
The most common mistake is reducing the strategy to:
Find FVG → Enter 50%
That is not the setup.
Imagine a trader sees a bullish 5-minute FVG during Asia.
FVG:
20,300 to 20,320
Midpoint:
20,310
The trader places a buy limit at:
20,310
But there was:
No clear Accumulation.
No Manipulation.
No confirmed bullish Distribution.
The trader traded an FVG.
They did not trade the Asia AMD model.
The correct sequence is:
A → M → D → First 5M FVG → 50%
Never:
FVG → Trade
Practical Example: Bullish Asia AMD
Suppose Asia begins trading inside:
20,400 to 20,500
For several candles, price remains inside this range.
Accumulation
High:
20,500
Low:
20,400
Later, price trades below the Accumulation low.
20,390
20,370
20,350
Manipulation Low:
20,350
Sell-side liquidity has been taken.
The trader does not enter yet.
Price then begins moving higher.
20,380
20,420
20,460
20,510
20,550
Bullish Distribution has begun.
During this initial Distribution, the first 5-minute bullish FVG forms between:
20,410
and
20,440
Calculate the Midpoint
20,410 + 20,440 = 40,850
40,850 ÷ 2 = 20,425
Entry:
20,425
Price later retraces:
20,520
20,480
20,450
20,430
20,425
The midpoint is reached.
The entry has an opportunity to fill.
The complete sequence was:
Accumulation:
20,400–20,500
Manipulation:
20,350
Distribution:
Bullish
First 5M FVG:
20,410–20,440
50%:
20,425
Entry:
20,425
Practical Example: Bearish Asia AMD
Suppose Asia accumulates between:
20,700 and 20,800
Accumulation
High:
20,800
Low:
20,700
Price later trades above:
20,800
and reaches:
20,850
Manipulation High:
20,850
Buy-side liquidity has been taken.
Price begins moving lower.
20,820
20,780
20,740
20,690
Bearish Distribution begins.
The first bearish 5-minute FVG forms between:
20,760
and
20,790
Midpoint
20,760 + 20,790 = 41,550
41,550 ÷ 2 = 20,775
Potential entry:
Sell 20,775
Price later retraces upward to:
20,775
The midpoint is reached.
The complete setup is present.
Practical Example: Manipulation but No Distribution
Accumulation:
20,400–20,500
Price sweeps below:
20,400
Manipulation:
20,370
Price returns to:
20,410
Then trades:
20,390
20,420
20,395
20,405
There is no meaningful bullish expansion.
No clean bullish Distribution develops.
Conclusion:
No AMD entry yet.
Do not search for a random FVG simply because the Accumulation low was swept.
Practical Example: Valid AMD, Missed Midpoint
Accumulation:
20,500–20,600
Manipulation:
20,450
Bullish Distribution:
Valid
First 5M FVG:
20,520–20,550
Midpoint:
20,535
Price retraces only to:
20,538
then rallies strongly.
Conclusion:
Valid AMD Setup — Missed Entry
There is no reason to chase.
Knowledge Check
Question 1
What does AMD stand for?
A. Average Market Direction
B. Accumulation, Manipulation, Distribution
C. Active Market Delivery
D. Automatic Market Decision
Answer: B
Question 2
What happens during Accumulation?
A. Price creates a recognizable range
B. Price must trend strongly
C. The trade is entered immediately
D. The market closes
Answer: A
Question 3
Where can buy-side liquidity exist around Accumulation?
A. Below the range low
B. Above the range high
C. At the midpoint only
D. Nowhere
Answer: B
Question 4
Where can sell-side liquidity exist?
A. Above the range high
B. Below the range low
Answer: B
Question 5
Does Manipulation automatically create an entry?
A. Yes
B. No
Answer: B
Question 6
What must happen after Manipulation?
A. Distribution must begin
B. Enter immediately
C. Find any FVG
D. Change timeframes repeatedly
Answer: A
Question 7
Which FVG is used for this beginner AMD strategy?
A. Any 1-minute FVG
B. The last FVG of the session
C. The first 5-minute FVG created during Distribution
D. Any FVG inside Accumulation
Answer: C
Question 8
What part of the FVG is used as the entry?
A. The high
B. The low
C. The 50% midpoint
D. The nearest round number
Answer: C
Question 9
A bullish FVG runs from 20,200 to 20,240. What is the midpoint?
Answer:
20,220
Question 10
Should you use an FVG created before Distribution begins?
A. Yes
B. No
Answer: B
Question 11
What should happen if the midpoint is never reached?
A. Chase the move
B. Change the entry
C. Accept the missed entry
D. Use the second FVG automatically
Answer: C
Question 12
What is the correct sequence?
A. FVG → Accumulation → Entry
B. Manipulation → FVG → Accumulation
C. Accumulation → Manipulation → Distribution → First 5M FVG → 50%
D. Distribution → Accumulation → Manipulation
Answer: C
Lesson Assignment
Review at least 20 completed Asia sessions.
For each session, record:
Date:
Accumulation present?
- Yes
- No
Accumulation High:
Accumulation Low:
Manipulated side:
- Buy-side
- Sell-side
- None
Manipulation extreme:
Distribution present?
- Yes
- No
Distribution direction:
- Bullish
- Bearish
- None
First 5-minute FVG:
FVG High:
FVG Low:
FVG Midpoint:
Did price retrace to the midpoint?
- Yes
- No
Entry available?
- Yes
- No
Classify the session:
- Valid Bullish AMD
- Valid Bearish AMD
- Manipulation With No Distribution
- No Clear Accumulation
- Valid AMD — Missed Midpoint
- No Setup
Save one screenshot for every example.
Do not change the FVG after seeing the final outcome.
Key Takeaways
- AMD stands for Accumulation, Manipulation, and Distribution.
- Accumulation creates the range.
- The Accumulation high and low create visible liquidity boundaries.
- Manipulation occurs when price attacks one side of the range.
- A sweep alone does not guarantee a reversal.
- I wait for Distribution after Manipulation.
- Distribution should show directional movement away from the Manipulation.
- I do not search for the strategy FVG until Distribution has begun.
- The setup uses the first 5-minute FVG created during Distribution.
- A bullish FVG is measured between Candle 1's high and Candle 3's low.
- A bearish FVG is measured between Candle 3's high and Candle 1's low.
- I use the 50% midpoint of the FVG as the entry.
- The midpoint provides an objective price.
- If the midpoint is never reached, the entry is missed.
- Do not chase a missed entry.
- Do not select a later FVG simply because it produced a better historical result.
- An FVG during Accumulation is not automatically the strategy FVG.
- An FVG during Manipulation is not automatically the strategy FVG.
- The FVG only becomes relevant because of the AMD sequence.
- No clear Accumulation means no clean AMD.
- Manipulation without Distribution means the sequence is incomplete.
- A valid setup can still fail.
- Risk management still applies to every entry.
Final Lesson Reminder
Do not begin an Asia AMD setup by searching the chart for Fair Value Gaps.
Begin with the story.
Ask:
Where is A?
Where is M?
Do I actually see D?
Then:
Where is the first 5-minute FVG?
Then:
Where is 50%?
The setup is:
ACCUMULATION
↓
MANIPULATION
↓
DISTRIBUTION
↓
FIRST 5-MINUTE FVG
↓
50% MIDPOINT ENTRY
The FVG is not what creates the setup.
The AMD sequence creates the reason that I care about that specific FVG.
Educational Disclaimer
Tick Lab is provided for educational and informational purposes only. AMD, liquidity concepts, Fair Value Gaps, and midpoint entries do not guarantee profitable trading results. Futures trading involves substantial financial risk. A valid setup can lose, and an entry order may not fill. Students should backtest the framework and practice in simulation before considering real financial risk.
 Image
Image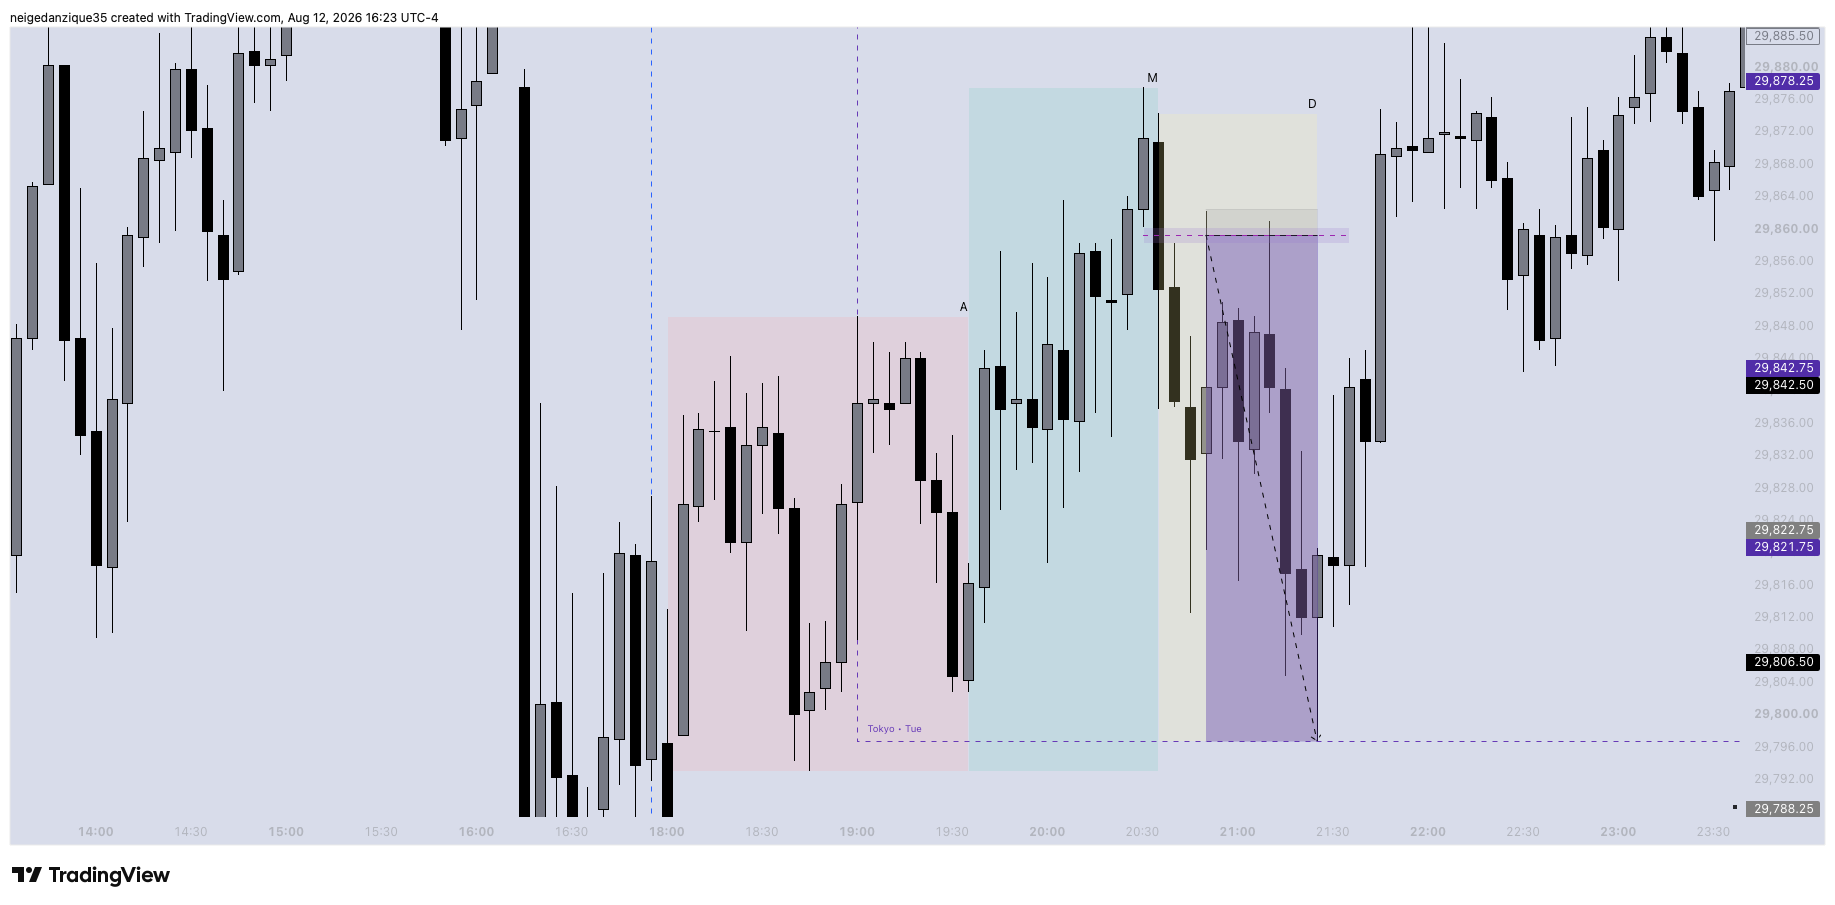 Image
Image